
Compare · prices checked 2026-09-03
RTX PRO 6000 WS vs H100 PCIE: specs, price per hour, which to rent
NVIDIA RTX PRO 6000 WS (96 GB, $1.097/hr) against NVIDIA H100 PCIE (80 GB, $2.147/hr): public specs side by side, live fixed prices from our sheet, what fits in each card's VRAM, and a verdict written for real workloads — both are rentable right now.
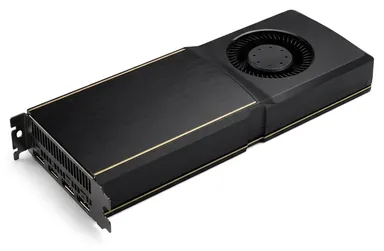
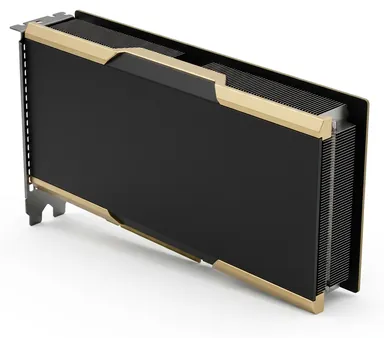
RTX PRO 6000 WS vs H100 PCIE specifications
Public NVIDIA figures (dense, non-sparsity). The last column is RTX PRO 6000 WS relative to H100 PCIE.
| Spec | RTX PRO 6000 WS | H100 PCIE | Difference |
|---|---|---|---|
| Architecture | Blackwell (2025) | Hopper (2022) | — |
| VRAM | 96 GB GDDR7 | 80 GB HBM2e | +20% |
| Memory bandwidth | 1,792 GB/s | 2,000 GB/s | −10% |
| FP16 tensor (dense) | 505 TFLOPS | 756 TFLOPS | −33% |
| FP32 | 125.0 TFLOPS | 51.0 TFLOPS | +145% |
| CUDA cores | 24,064 | 14,592 | +65% |
| TDP | 600 W | 350 W | +71% |
| PCIe · NVLink | Gen 5.0 · no NVLink | Gen 5.0 · no NVLink | — |
| PowerScore (RTX 3090 = 100) | 356 | 532 | −33% |
| Max GPUs per machine | 8× | 8× | — |
RTX PRO 6000 WS vs H100 PCIE price per hour
Fixed rates from our sheet — every on-demand price is the marketplace median × 0.70, rounded down. Monthly = 730 hours.
| Rate | RTX PRO 6000 WS | H100 PCIE | Cheaper |
|---|---|---|---|
| On-demand, per GPU-hour | $1.097 | $2.147 | RTX PRO 6000 WS (−49%) |
| Interruptible, per GPU-hour | $0.548 | $1.073 | RTX PRO 6000 WS |
| Reserved (3 mo), per GPU-hour | $0.713 | $1.395 | RTX PRO 6000 WS |
| On-demand, per month | $801 | $1,567 | RTX PRO 6000 WS |
| Market median (reference) | $1.57 | $3.07 | — |
| $ per 1,000 FP16 TFLOP-hours | $2.17 | $2.84 | RTX PRO 6000 WS (better value) |
| $ per GB of VRAM per hour | $0.0114 | $0.0268 | RTX PRO 6000 WS (better value) |
Try a full month with storage and bandwidth in the GPU cost calculator.
What fits in VRAM: 96 GB vs 80 GB
| Workload | RTX PRO 6000 WS | H100 PCIE |
|---|---|---|
| Largest LLM in FP16, one card | ~32B | ~32B |
| Largest LLM at 4-bit, one card | ~141B | ~123B |
| Flux dev (FP8, ~17 GB) | fits | fits |
| Wan 2.x 14B video (offloaded) | yes | yes |
| 70B 4-bit LLM on one card | yes | yes |
Rules of thumb: ~2.4 GB per billion parameters in FP16 all-in, ~0.62 GB in 4-bit. Full tables in the VRAM guide.
Verdict: which should you rent?
96 GB of GDDR7 and more CUDA cores on the RTX PRO 6000 versus 80 GB of HBM2e and datacenter interconnect on the H100 PCIe. The PRO 6000 wins rendering, FP4 inference and single-card capacity; the H100 wins bandwidth-bound training and FP8 throughput.
- Cheaper per hour: RTX PRO 6000 WS ($1.097 vs $2.147, −49%).
- More VRAM: RTX PRO 6000 WS (96 GB vs 80 GB).
- More FP16 throughput: H100 PCIE (about 1.5×).
- Best value per TFLOP-hour: RTX PRO 6000 WS.
- Best value per GB of VRAM: RTX PRO 6000 WS.
- Multi-GPU: RTX PRO 6000 WS over PCIe · H100 PCIE over PCIe.
Related comparisons
RTX PRO 6000 WS vs H100 PCIE: FAQ
Deeper reading: H100 vs H200 vs B200, RTX 4090 vs RTX 5090, how cloud GPU pricing works.
Is the H100 PCIE faster than the RTX PRO 6000 WS?
On dense FP16 tensor throughput the H100 PCIE leads by about 1.5× (756 vs 505 TFLOPS). Memory bandwidth matters as much for inference: RTX PRO 6000 WS 1,792 GB/s vs H100 PCIE 2,000 GB/s.
Which is cheaper to rent, the RTX PRO 6000 WS or the H100 PCIE?
The RTX PRO 6000 WS: $1.097/hr on-demand versus $2.147/hr — 49% less. Interruptible rates are $0.548 (RTX PRO 6000 WS) and $1.073 (H100 PCIE). Per TFLOP-hour the better value is the RTX PRO 6000 WS.
Which has more VRAM and what does that change?
The RTX PRO 6000 WS has 96 GB versus 80 GB. In LLM terms that is roughly a 32B FP16 model (or ~141B in 4-bit) on one card against 32B FP16 (~123B 4-bit). If the model does not fit, speed is irrelevant.
Can I rent both on PowerGPU right now?
Yes — 52 × RTX PRO 6000 WS and 60 × H100 PCIE are online as this page renders, deployable in about 30 seconds, billed per second, paid in crypto with no KYC.